

S&P 500 Falls Below 50-Day Average | Historical Market Pattern Analysis
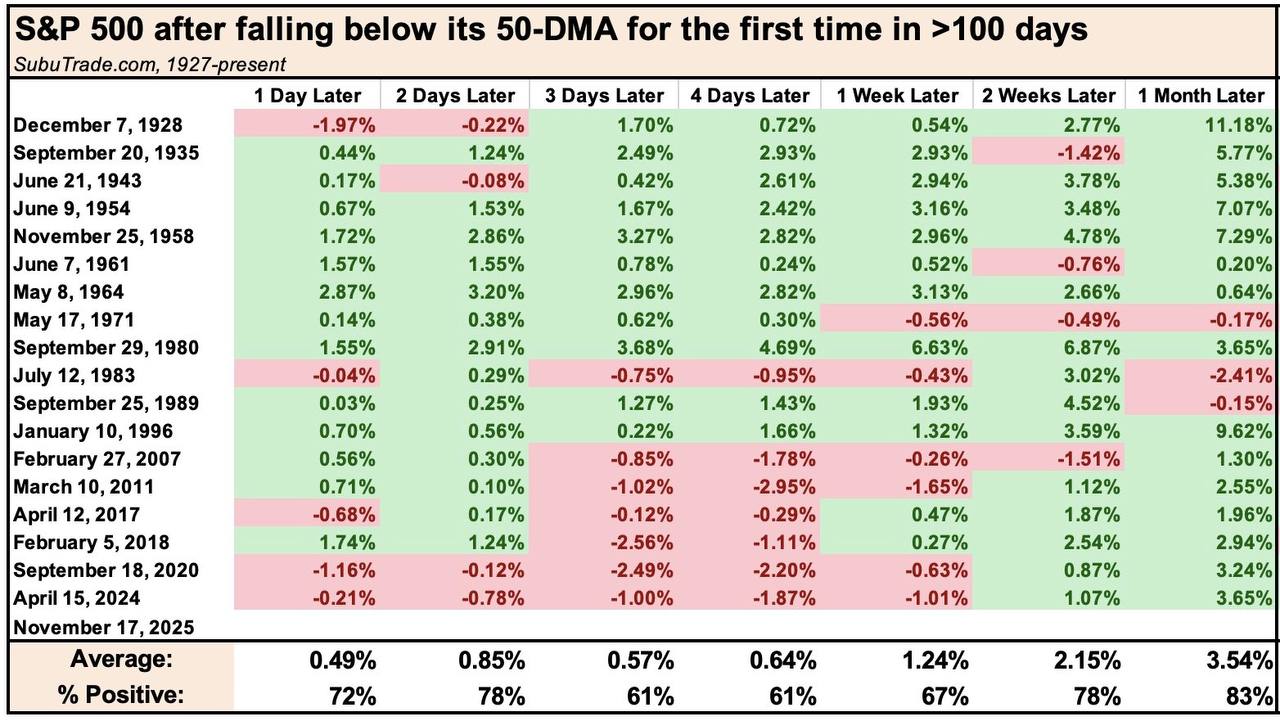
Yesterday, the S&P 500 closed below its 50-day moving average for the first time in 138 days. That’s more than four months of staying above this key trend line — until now. If you’re wondering what tends to follow, a century of data from SubuTrade.com offers a clear pattern.
? Short-term: history leans positive
Two weeks after similar streak breaks, the S&P 500 averaged a 2.15% gain, with 78% of cases finishing higher. A small dip, then a steady reset.
⏳ Medium-term: even steadier
Six months later, returns averaged 8.61%, with 83% of cases higher. More of a quiet climb than a surge — but consistent nonetheless.
? A century of context
Across 100 years of patterns like this, the first slip under the 50-DMA hasn’t usually meant a trend break. More often, it creates one of those moments traders watch closely — when history tilts the probabilities and the next move becomes more interesting than the drop itself.